1 In your own words, briefly describe what a social network is and why sociologists are interested in looking at those. (1 point)
2 Examine the two networks shown below.
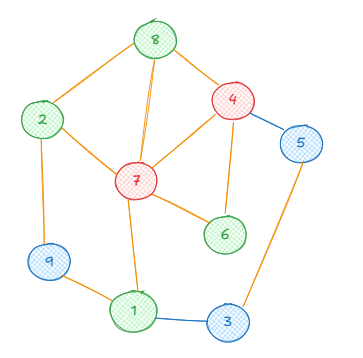
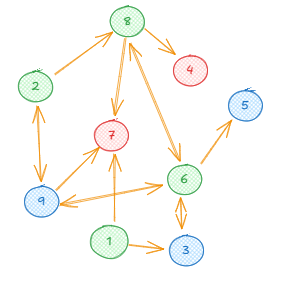
2.1 Formally describe the networks. (3 points)
2.2 Provide one real-world example for each type of network shown in the Figure. (1 points)
2.3 Based on the directed network (figure b), write down the corresponding adjacency matrix. (3 points)
3 A city partnership (also known as a twin city or sister city relationship) is a formal agreement between two cities (most of the time from two different countries) to promote cultural and economic collaboration. The city of Leipzig has 15 such twin cities. In the speicherwolke, you will find an R data file named twin_cities.rds, which contains a list of Leipzig’s partner cities and their own partner cities. You can load the file into R using the following command:
twin_cities <- readRDS("your/path/twin_cities.rds")
3.1 Using this data, create an igraph object where each node represents a city. Add an edge between two cities if they are partnered and include the country of each city as a vertex attribute. You will need to clean the dataset before creating the graph. In particular, there are minor inconsistencies caused by incorrect handling of whitespace and special characters. Carefully inspect the dataset and fix issues such as extra or missing spaces, inconsistent city name formatting, and incorrectly encoded characters to ensure that identical cities are represented consistently. (5 points)
3.2 Categorize the form of data collection. (1 point)
3.3 Calculate the density of the network. Then explain in one or two sentences what this value tells you about the structure of the network. (2 points)
3.4 Determine the diameter of the network. What does this diameter represent in the context of the city partnership network? (1 point)
3.5 Find the shortest path between the cities Budapest and Wuhan. List all cities that lie along this path. (1 point)
3.6 Describe the distribution of shortest paths in the network. Then interpret what this distribution tells you about the overall connectivity of the cities. Did you expect this? (2 points)